
This is a guest post from Chris at PortfolioAtlas (a tool that maps 100+ cities to the portfolio size you’d need to retire in each one).
If you’ve been around the FIRE community for more than a week, you know the drill…
Spend less than you earn, invest the difference, and let your savings rate do the heavy lifting.
Push your savings rate from 40% to 50% and you knock years off the timeline. Push it to 65% and you’re done before most people have paid off their car.
I’ve spent a lot of time staring at that math. But there’s another lever that almost nobody in the community actually pulls. It’s not how much you save, it’s where you plan to spend it.
The 4% rule says your FIRE number is just your annual spending times 25. We obsess over the “times 25” part and the savings rate that gets us there. But “annual spending” is dominated by one variable most people treat as fixed – the cost of living wherever you happen to live. Change the city and you change the target (sometimes by a factor of four).
I want to show you what that looks like with real numbers, why I think geography is the most underrated risk-management tool in early retirement, and how many years it could shave off your timeline.
How does location change your FIRE number?
Here’s the comparison that started all of this.
I took a single, fixed lifestyle (what I’d call a comfortable retirement) and held it constant – a nice apartment, dining out regularly, decent healthcare, the occasional trip. Then, I let only the city change and applied the same 4% rule to each.
The spread is bigger than most people guess:
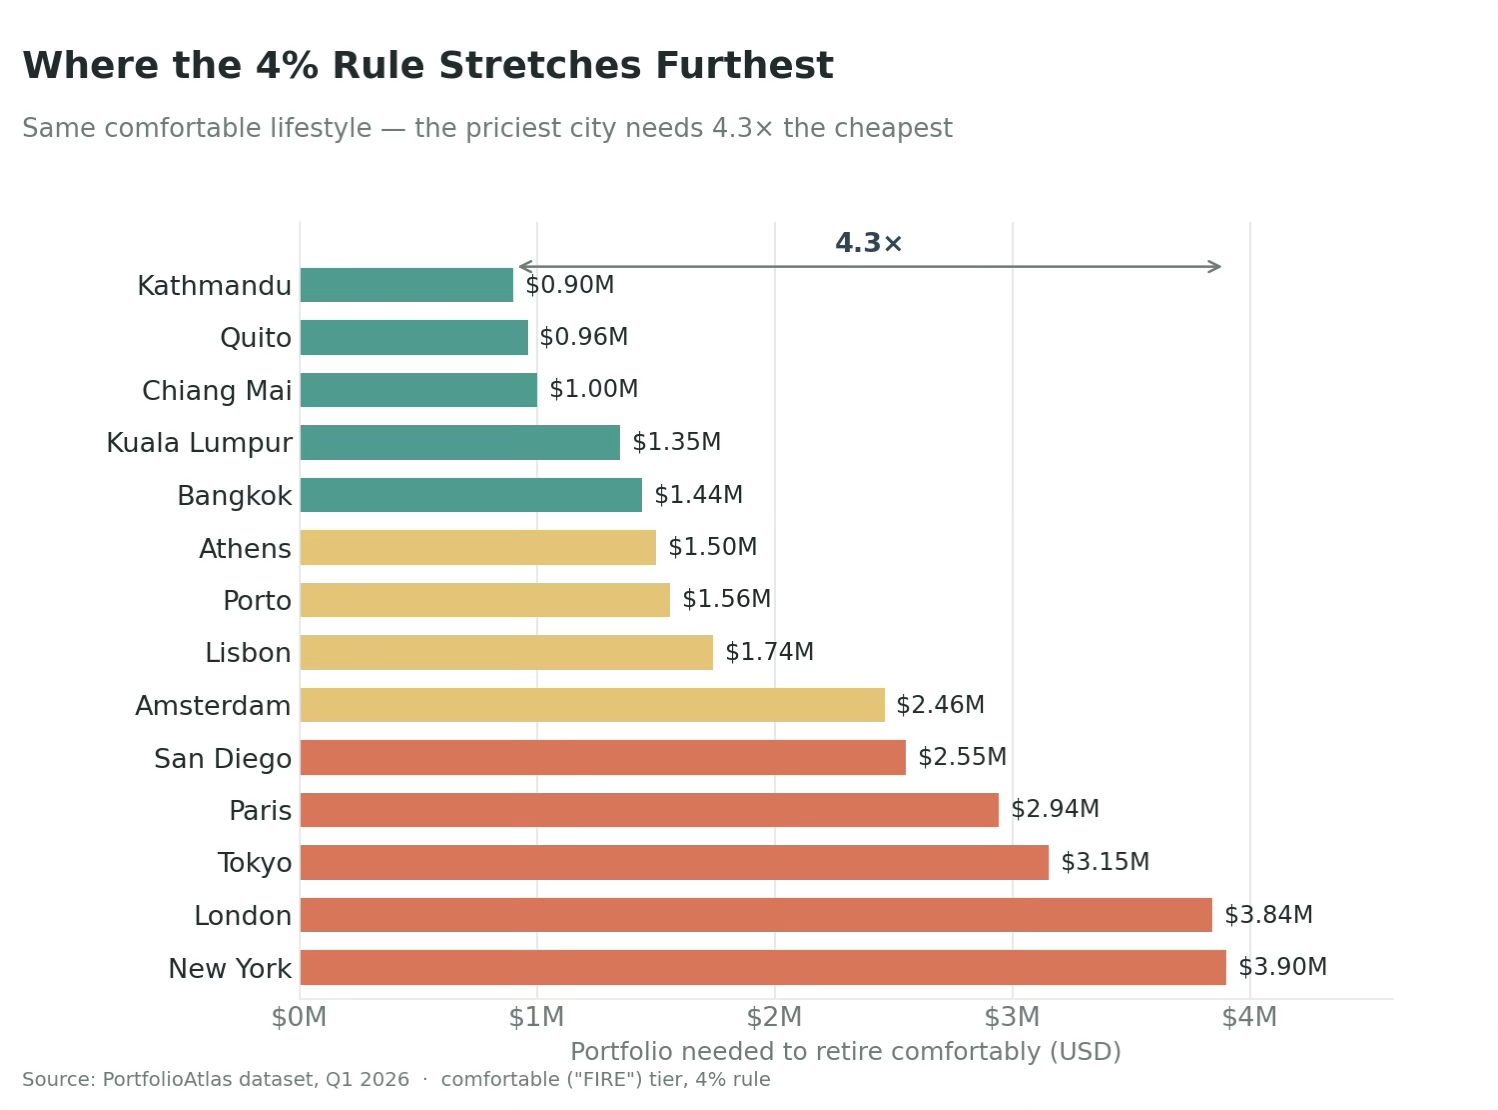
| City | Comfortable FIRE Number | Monthly Spending it Supports |
|---|---|---|
| 🇳🇵 Kathmandu, Nepal | $900K | $3,000 |
| 🇹🇭 Chiang Mai, Thailand | $1.0M | $3,333 |
| 🇵🇹 Porto, Portugal | $1.56M | $5,200 |
| 🇺🇸 US average (46 cities) | $2.08M | $6,933 |
| 🇺🇸 San Diego, USA | $2.55M | $8,500 |
| 🇺🇸 New York, USA | $3.9M | $13,000 |
Same lifestyle. The most expensive city in the dataset (New York, at $3.9M) requires 4.3 times the portfolio of the cheapest (Kathmandu, at $900K). Put differently: the gap between retiring in New York and retiring in Chiang Mai is roughly $2.9 million – more than most people’s entire FIRE number.
And this isn’t a story about slumming it. The $1M “comfortable” tier in Chiang Mai buys a private pool villa or a premium condo, regular dinners at the best restaurants in town, a leased car, and premium international health insurance. It’s not deprivation. It’s just a different price tag for a similar life.
The patterns aren’t random, either. When I group the cities by region, they cluster the way you’d expect:
- Southeast Asia (Chiang Mai $1M, Kuala Lumpur $1.35M, Bangkok $1.44M) and parts of Latin America (Quito $960K, Medellín, the Mexican mid-tier $1.14M–$1.5M) anchor the low end.
- Southern and Eastern Europe sit in the comfortable middle (Porto and Budapest around $1.56M, Athens and Valencia near $1.5M–$1.56M).
- Western Europe and the global financial capitals run hot (Amsterdam $2.46M, Paris $2.94M, Tokyo and Hong Kong $3.15M, Singapore $3.24M, London $3.84M, New York $3.9M).
The takeaway is simple but under appreciated: your retirement number is mostly a function of geography, and geography is a choice.
Most of us inherit it by default instead of choosing it on purpose.
Geographic arbitrage is a hedge
Here’s where it gets interesting, and where I think the FIRE community has been leaving something on the table.
The scariest risk in early retirement isn’t a bad average return, it’s sequence-of-returns risk (i.e. a nasty market in your first few years, when you’re selling assets that won’t be able to recover). The same 30% drop does far more damage in year one than in year fifteen, because you’re drawing down a shrunken portfolio at exactly the wrong moment.
The standard defenses are familiar: a cash cushion or bond tent, flexible withdrawal rules, a bit of “Barista FI” income. All solid, but there’s another lever that rarely gets mentioned, and the cost data makes it concrete: a flexible cost base.
If your spending can drop by relocating, your withdrawal rate falls in precisely the years you most need it to.
Say you retire in San Diego with a comfortable $2.55M portfolio, drawing $102,000 a year – a textbook 4% withdrawal. Then the market hands you a 30% drop in year one. Your portfolio is now $1.785M, and that same $102,000 is suddenly a 5.7% withdrawal rate – squarely in the danger zone for a multi-decade retirement.
Now suppose you have somewhere to go. You move to Porto, where that same comfortable lifestyle costs about $62,000 a year:
| Response to the Crash | Annual Spending | Withdrawal Rate on $1.785M |
|---|---|---|
| Stay in San Diego | $102,000 | 5.7% (risky) |
| Relocate to Porto | $62,400 | 3.5% (safe) |
| Relocate to Chiang Mai | $40,000 | 2.2% (very safe) |
You didn’t sell a single extra share. You didn’t touch your asset allocation. You just changed your burn rate, and a dangerous withdrawal rate became a conservative one, buying your portfolio years to recover.
The part I find most compelling is that this is a real option, in the financial sense. It has value even if you never exercise it. You don’t have to spend your retirement as an expat. You just have to be genuinely willing and able to move if the early years go badly.
Most hedges cost you something on the way in – cash drag, lower equity exposure, a lower withdrawal rate forever. Keeping geographic flexibility is a hedge that doesn’t cost you anything up front.
Same savings rate, different finish line
So if geography moves the target this much, what does it do to your timeline?
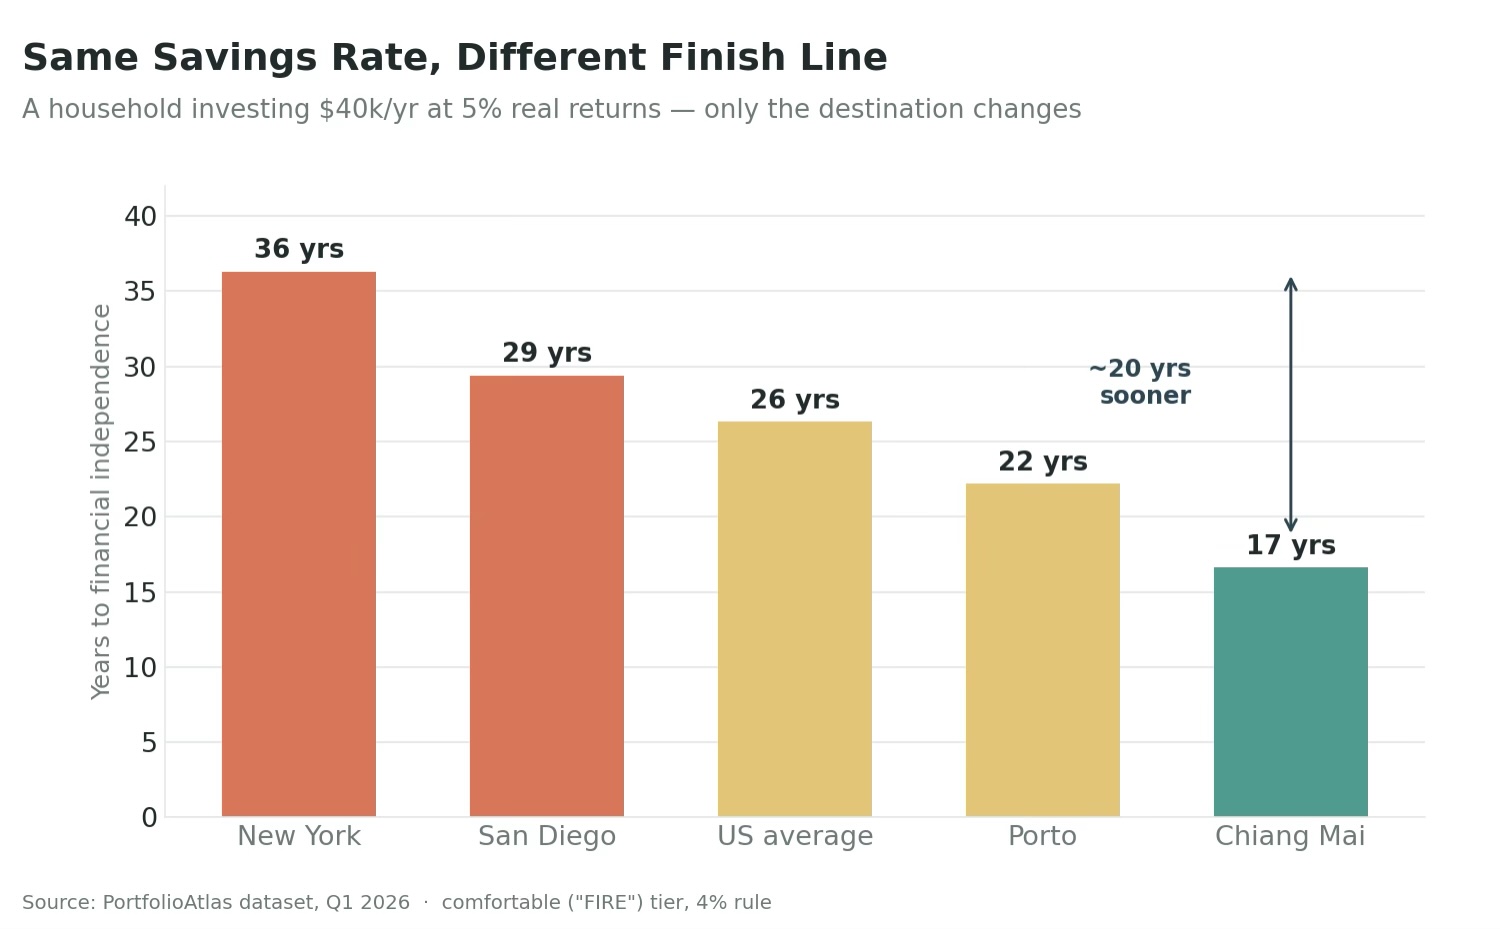
Let’s hold the savings constant and change only the destination. Take a household investing $40,000 a year, earning a 5% real return, starting from zero. Here’s how long it takes to hit each FIRE number:
| Retire in… | FIRE Number | Years to get there | Years saved vs. New York |
|---|---|---|---|
| 🇺🇸 New York | $3.9M | 36.3 | – |
| 🇺🇸 US average | $2.08M | 26.3 | 10.0 |
| 🇵🇹 Porto | $1.56M | 22.2 | 14.1 |
| 🇹🇭 Chiang Mai | $1.0M | 16.6 | 19.7 |
Same income. Same savings. Same returns. The only thing that changed is the city you’re aiming at – and it’s the difference between working another 16 years or another 36.
Now put that next to the lever everyone actually pulls. Our New York saver decides to get serious and bumps their savings rate by 5 percentage points – going from saving $40,000 to $45,000 a year on a $100K income. Admirable. It cuts their timeline from 36.3 years to 34.3 years. Two years.
Choosing a mid-cost US city instead of New York? Ten years.
Choosing Chiang Mai? Nearly twenty.
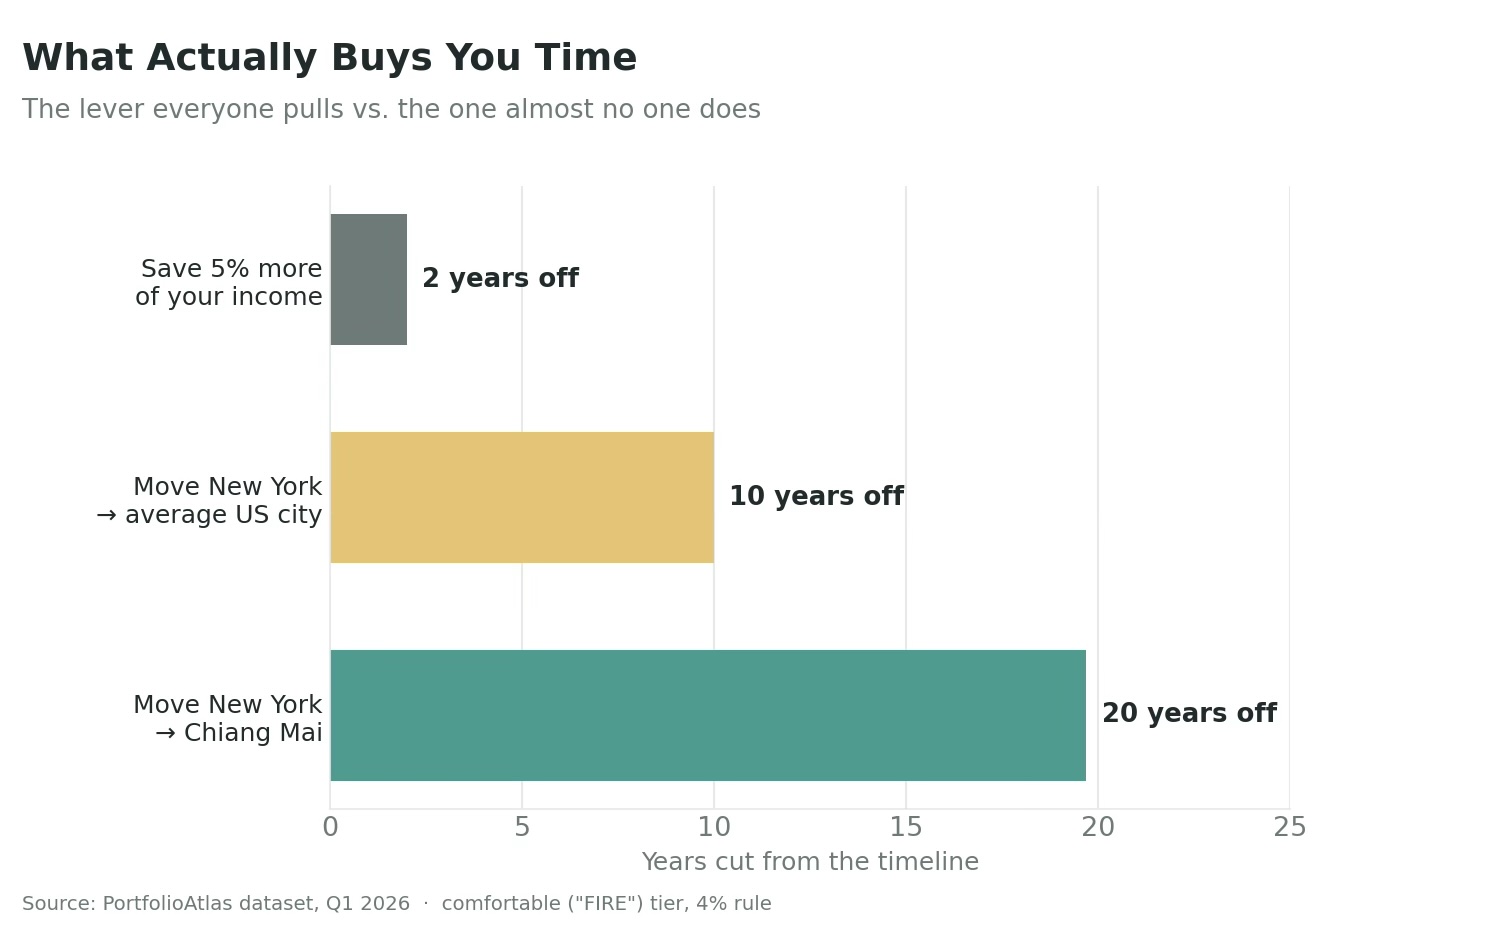
Bumping your savings rate 5 points buys you about 2 years. Changing your retirement destination from New York to an average US city buys you 10. To Chiang Mai, almost 20.
That’s not an argument against a high savings rate. It’s an argument that we’ve been quietly ignoring a lever that’s often several times more powerful, just because it lives on the spending side of the equation and feels less like a personal-finance decision and more like a life decision.
Best of both worlds
There’s also a best-of-both-worlds version of this that’s worth naming: you can decouple where you earn from where you spend. Accumulate in a high-income city, then retire somewhere your money goes further. You get the fat paychecks during the climb and the low target at the finish. The geographic arbitrage doesn’t have to start the day you stop working.
The honest caveats
I’d be doing you a disservice if I made this sound like a free lunch, so here’s the asterisk section.
- Healthcare – This is the big one, especially for US readers. Some of that low cost of living abroad assumes private insurance in countries where care is excellent and cheap (Chiang Mai’s comfortable tier already budgets premium international coverage), but you need to plan it deliberately, and visa-dependent coverage adds complexity.
- Visas and taxes – You don’t escape the IRS by moving – US citizens are taxed on worldwide income. Tax treaties, the Foreign Earned Income Exclusion, and residency rules all matter, and they’re worth real research (and a professional) before you commit. This post is strategy, not tax advice.
- Currency and local inflation – Part of the arbitrage can evaporate if your home currency weakens or the local cost of living climbs faster than yours would have at home. The cheap city today isn’t guaranteed to stay cheap.
- The non-financial cost – Family, friends, kids’ schooling, language, community – these don’t show up in a cost-of-living table, and they’re often the real deciding factors. The cheapest number is not automatically the best life. Cost is one input, not the whole decision.
The point isn’t that everyone should move. It’s that everyone should price the option. Geography is a lever sitting right there on the dashboard, and most of us have never even touched it.
How to run your own numbers
If this reframed anything for you, here’s the three-step version:
- Pin down your real lifestyle.
- Look up the FIRE number for two or three candidate cities at that lifestyle. We recommend you include your current city as the baseline.
- Compare the timelines. Same savings rate, different finish lines. The gap is often measured in years, not months.
That’s exactly what I built PortfolioAtlas to do. It maps a portfolio to every city where it’s enough, across 100+ cities and 47 countries, with cost breakdowns and Monte Carlo-simulated confidence levels for each one. You can compare any cities side by side to see the timeline gap for yourself (and since this is the Mad Fientist audience: every number here uses the 4% rule, but the tool models longer-horizon withdrawal rates too, because a 45-year retirement isn’t the same animal as a 30-year one).
Savings rate is the lever everyone pulls. Geography is the one almost no one does. And for a lot of people, geography is the bigger of the two.
Chris runs PortfolioAtlas, a free tool that shows you where in the world your portfolio can buy you financial freedom. All figures are from the PortfolioAtlas dataset, Q1 2026.

Try to use fewer AI writing suggestions, your writing voice is much more interesting without AI rounding off edges and adding filler.
It’s a guest post, so it’s not my voice!
I never use AI for anything writing related (for the reasons you mentioned). I use it all the time for coding though :)