
Welcome to the Guinea Pig experiment, the experiment where we watch the entire journey of someone going from $0 to financial independence!
In this experiment, we follow two different scenarios – one baseline scenario and one optimized scenario.
The baseline scenario invests all savings into a taxable investment account. The optimized scenario utilizes some of the advanced tax-avoidance strategies I write about here.
For example, the optimized scenario:
- Reduces taxes by taking full advantage of workplace retirement accounts and contributing to the best type of IRA for early retirees
- Increases time in the market by front-loading tax-advantaged accounts
- Reduces FICA taxes by contributing to the ultimate retirement account
Comparing these two scenarios will allow us to see how many years earlier someone could retire if the strategies and tactics discussed on this site are applied in real life!
This page serves as the main hub for the experiment and will be kept up-to-date with the progress of the Guinea Pigs throughout their journeys.
Graphs
Here are the FI Laboratory graphs for the two Guinea Pig scenarios, showing their progress from the start of the experiment (Jan 1st, 2014) to the most-recent update (Jan 1st, 2021).
The FI Laboratory is a web application I created that allows you to easily chart your progress to financial independence, as recommended in the classic book on financial independence – Your Money or Your Life.
If you haven’t started charting your own progress yet, sign up for a free Personal Capital account to automatically calculate your net worth, monthly spending, etc. and then plug those numbers into the FI Laboratory to see if you can keep up with the Guinea Pigs!
Normal Scenario
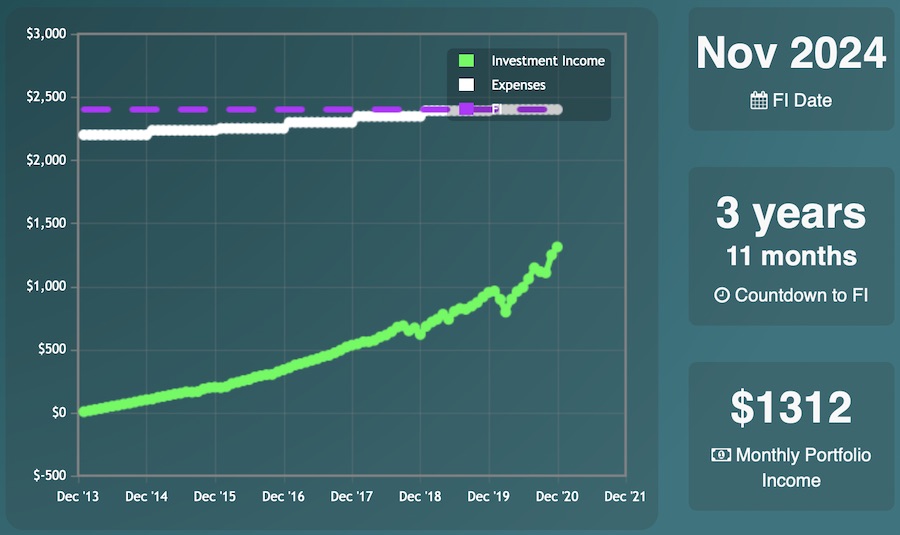
Normal Guinea Pig – January 2021
Optimized Scenario
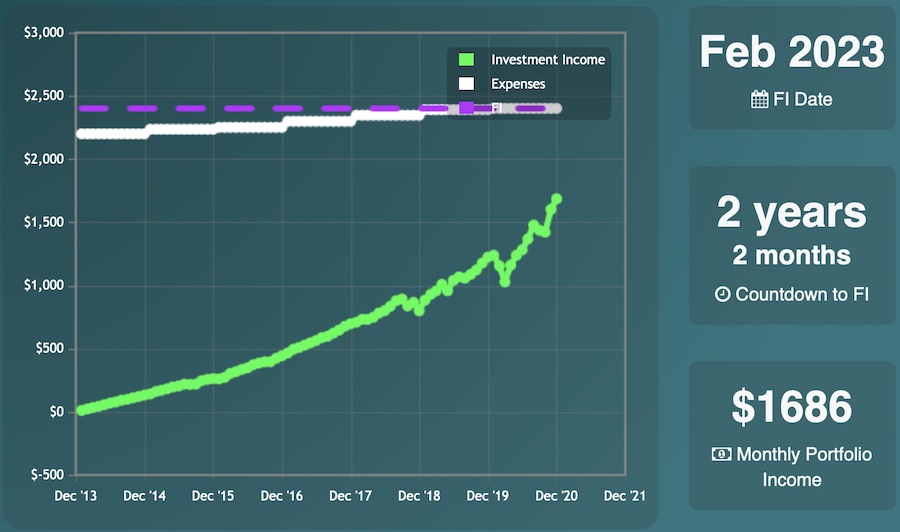
Optimized Guinea Pig – January 2021
Net Worth Values
- Normal Scenario: $393,638
- Optimized Scenario: $505,949
The Optimized GP has over $100,000 more than the Normal GP and can retire almost 2 years earlier, even though they’ve both earned and spent exactly the same amount!
Experiment Assumptions
Both Guinea Pigs are single (with no kids), live in income-tax-free states, invest all money into Vanguard’s Total Stock Market ETF (VTI), and adhere to the following numbers that Mad Fientist readers chose at the beginning of the experiment (numbers are adjusted annually for inflation/raises/etc.):
- Pre-tax Income: $89,593 ($7,466 per month)
- Spending: $28,809 ($2,401 per month)
- Employer 401(k) Match: 3%
Numbers
To see all of the guinea pigs’ numbers (i.e. contributions, account balances, etc.), check out the full spreadsheets here.
And if you haven’t already, sign up for a free FI Laboratory account here to start tracking your own progress to financial independence!
Optimizations
401(k) Match
The first thing the Optimized GP does differently than the Normal GP is he takes advantage of his employer’s 3% 401(k) match. This may seem like an obvious move to most of you but there are many Americans who leave this free employer money on the table.
401(k) Max
The Optimized GP also maxes out the rest of his 401(k).
If you’re thinking to yourself that maxing out the 401(k) is a stupid move, since the GP will need to access that money long before traditional retirement age, check out this post to learn how to tap into that money early without paying any fees (or even taxes, if you plan properly).
Health Savings Account
After reading my Ultimate Retirement Account article, the Optimized GP decides to max out his Health Savings Account too.
As described in that article, the HSA is actually a super IRA in disguise and is one of the best retirement accounts available!
Traditional IRA
Thanks to my Traditional IRA vs. Roth IRA article, the Optimized GP maxes out his Traditional IRA as well, since that’s better than a Roth IRA for most early retirees.
Front Loading
As I described in my Front Loading article, it makes sense to max out your retirement accounts at the beginning of the year so that your tax savings have more time to grow.
This won’t be beneficial every year but since the market’s overwhelming long-term trend is up, it’s beneficial more often than it’s not so it’s a good long-term strategy and is what the Optimized GP does.
Tax-Loss Harvesting
Although the COVID crash in March of 2020 would have been a great opportunity to harvest tax losses, the Optimized Guinea Pig didn’t because he thought the markets would drop further so he delayed tax-loss harvesting and missed his chance when prices recovered quicker than expected. So even though he’s optimized, he’s still not perfect (since this is a real-time experiment, I have to leave little investor mistakes like this in there).